After building out your Plays, you will want to track and measure the success of your strategy. With CRM reporting you can verify:
- Reps are adopting your Play strategy versus just using Click-to-Call and Click-to-Email
- Robots are working as intended
- Play steps are not being skipped over abundantly
- Which Plays are meeting their objectives by being marked as Successful
- And much more
Here are four crucial reports you should become familiar with. Creating a dashboard and sharing with Playbooks users and managers is highly advised.
Note: There are many other reports that can be created in CRM to track activities, call recordings, and other aspects of Playbooks. This topic, however, will focus on reports that help you track your Play strategy.
Play Enrollment Current Status By Play and By Rep
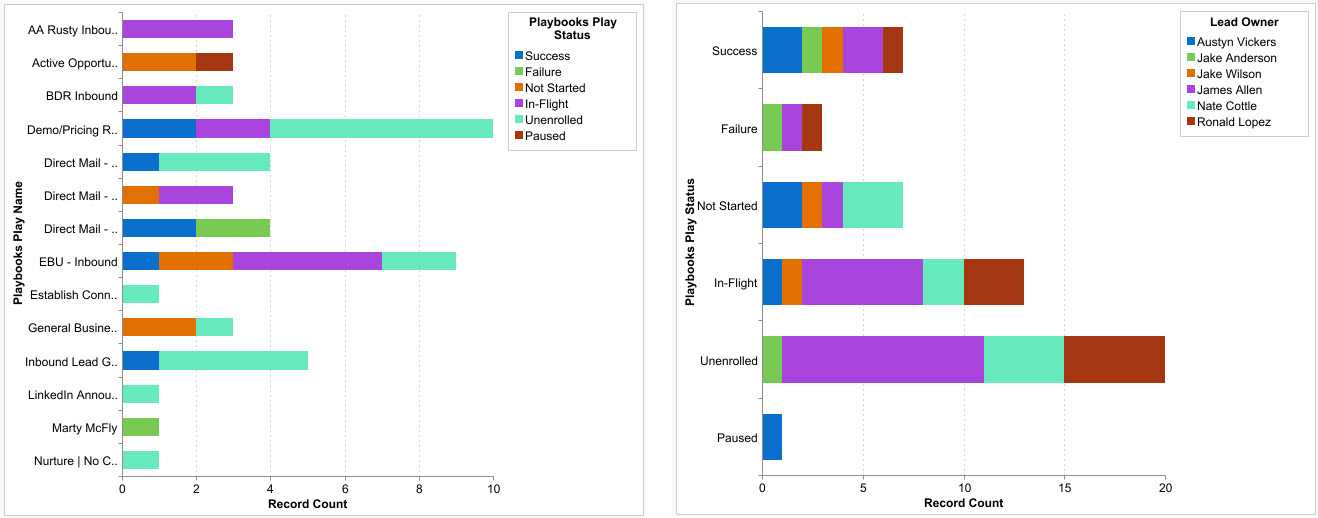
The two charts above detail the current status of records. On the left, the records are grouped by Play. On the right, the records are grouped by Playbooks user (designated by the Lead Owner field).
These two reports give a great high-level view of your strategy and who is adopting. Here are a few highlights to take note of:
- A status of In-Flight shows the number of records that are being ACTIVELY worked.
- Unenrolled records have been removed from the Play but not from Playbooks. They are cluttering up user’s Playbooks not being pursued or disqualified. You typically want this number to be low.
- This report is NOT the best way to evaluate Play success or failure because a record’s Playbook Play Status will be changed from Success or Failure if it is moved into another Play. See the section below: Tracking Play Success.
- Mass pausing records is one way to quickly shift to a temporary strategy, or it can be used by Reps who are out of the office. Looking at the chart on the right, it is clear that only one rep has paused records and is probably on vacation.
- If a Robot were responsible for enrolling records into the “EBU – Inbound” Play you would want to keep an eye on the number of records with a status of Not Started. This would tell you if your Playbooks is being flooded with records or your criteria is too narrow.
What observations can you draw from these example reports?
Call Steps by Play vs. Click-to-Call
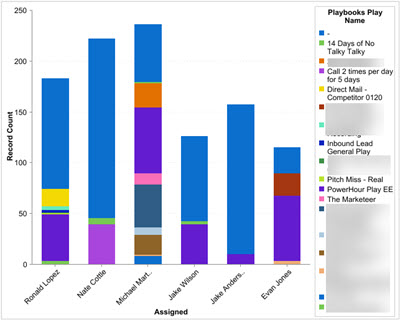
The chart above will help you to compare calls that are being made from Play tasks versus Click-to-Call. This is important if you’ve set the expectation with sellers that they should predominantly be using Plays to guide their activities. Sellers that deviate from this strategy can still browse directly to the CRM record and click the hyper-linked phone number to make dials through Playbooks. This is an acceptable motion if sellers are calling someone back or reaching out for clarification. It should not represent the dominant portion of calls.
Click-to-Call dials are represented in the chart above where the Playbooks Play Name is blank. This allows you to compare the total dials to just Click-to-Call dials. Your coaching conversation will vary if they are completing call tasks AND Click-to-Call dials versus ONLY making Click-to-Call dials.
To create the report, you would first filter for activities with a Playbooks Step Type equal to “Phone” and group the records by Rep. Then add a column for Playbooks Play Name.
What observations can you draw from this example report?
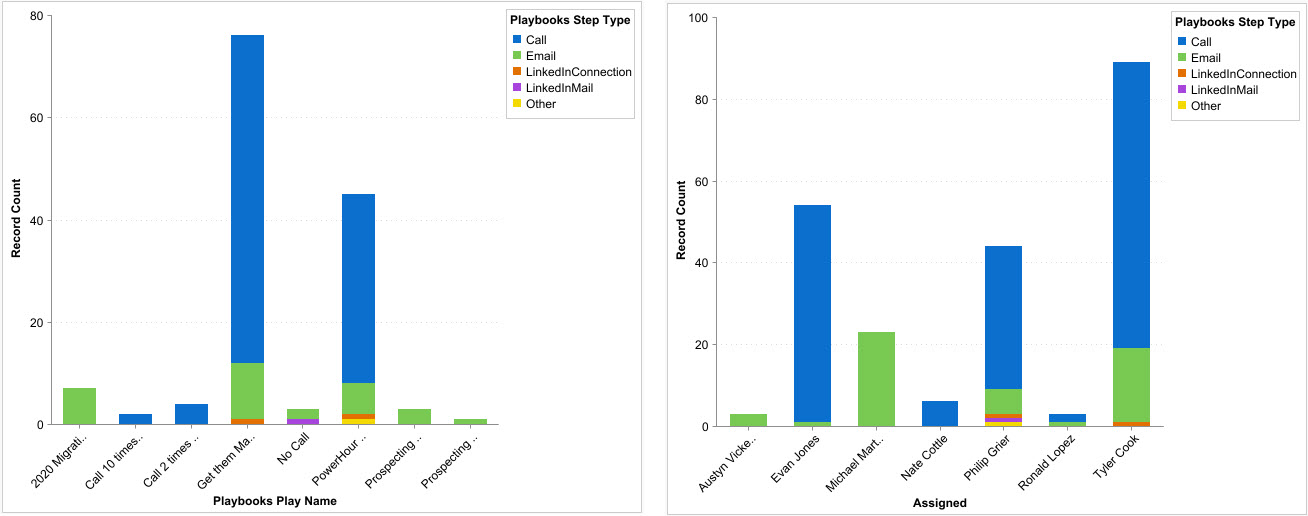
Tracking Play Success
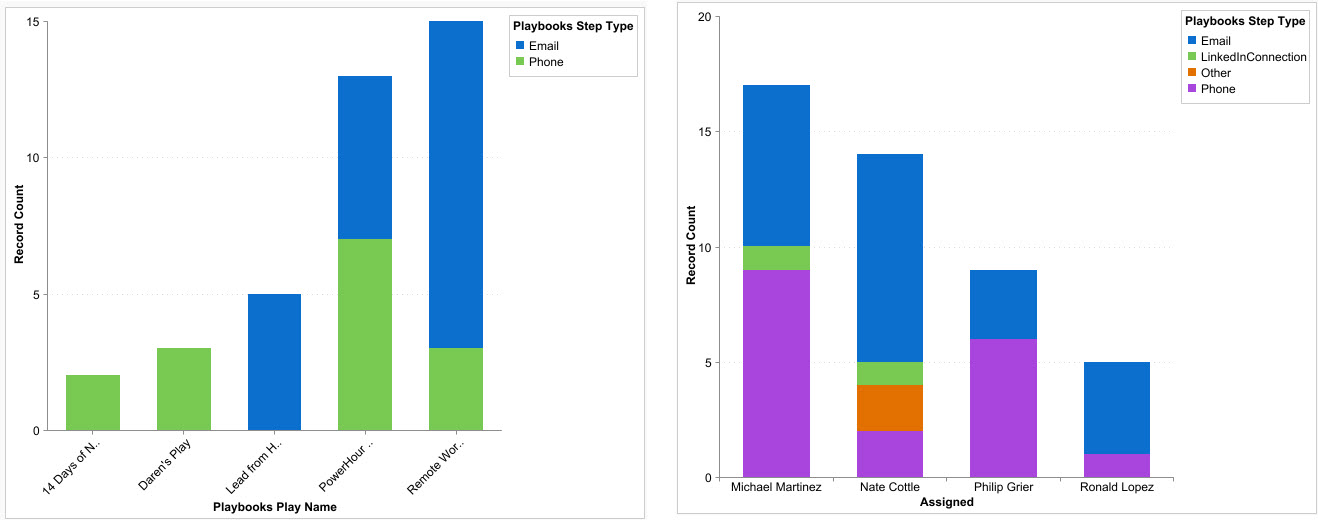
When a user marks a Play as Successful in Playbooks, a checkbox on the most recently completed activity record for that Lead/Contact/Account/Opportunity is checked. The name of that checkbox field is Playbooks Step Success.
When evaluating success, you can view by Play (on the left) or by seller (on the right). Here are a few highlights to take note of:
- Grouping the successful activities by Step Type is helpful so you can also see if the right distribution of phone, email, LinkedIn, and other steps are being completed.
- The chart on the left is crucial when A/B testing your Plays.
To track a seller’s success over time, you could add the completed date to the report and group by calendar week. A well-planned Playbooks Strategy should aim for smooth increase in success as you iterate and improve the strategy over time. Spikes and drops should be an alert that either the strategy needs help, or the seller does.
What observations can you draw from these 3 reports?
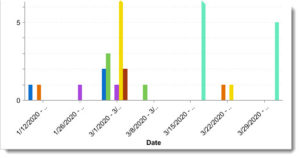
Skipped Play Steps by Play and Rep
 The final reports you should be aware of to track your Play Strategy adoption is Skipped Steps. Once again, if you’ve purposely built your strategy, you want to know where it is being circumvented and by whom. Then you can have a constructive conversation to figure out WHY, which a CRM report isn’t going to tell you. Route this through the Center of Excellence and Frontline Representatives group.
When a task is skipped in Playbooks, an activity record is created in CRM with a subject of “[Step Type] – Skipped”. In your report, you can filter for activity records where subject contains “Skipped”.
Here are some items to look out for and give perspective:
- Stack grouping the skipped tasks by Type will quickly highlight if calls, emails, or other step types are the main offenders. If it’s an email you can adjust the email template by working with Marketing. If it’s a call, ask reps questions about timing and the Cue Card.
- Spikes on the left chart are a bright neon sign pointing to issues with the Play. Spike on the right aren’t as clear. You should compare Skipped Steps by Rep to their total activity volume. Reps who complete more activities than their teammates will most likely have a higher volume of skipped steps. But if a rep has a moderate or low volume of activity with a moderate or high volume of skipped tasks, the Enablement Team should be notified for coaching and training.
- Similar to tracking Play success, adding the date field to a separate report can be interesting to see trends over time.
- It’s okay to see skipped tasks. The Skip Task feature was purposely added to Playbooks because there are real situations when it isn’t appropriate to complete the prescribed task.
What other observations can you draw from these reports?
We highly recommend that you create and add these reports to a Playbooks Adoption Dashboard and share (when appropriate) with Playbooks Managers and Sellers. Giving visibility to the playbook (pun intended) and the score board is equally important.